In 2026 we’re pushing for our best waste performance yet. Your monthly waste report reveals how your day‑to‑day choices are shaping those results and gives you a clear look at the difference you’re already making and where there is room for improvement.
It’s a practical tool that turns everyday recycling habits into something you can track, celebrate, and build on. Using the dashboard snapshot below as an example, we explain key elements below:
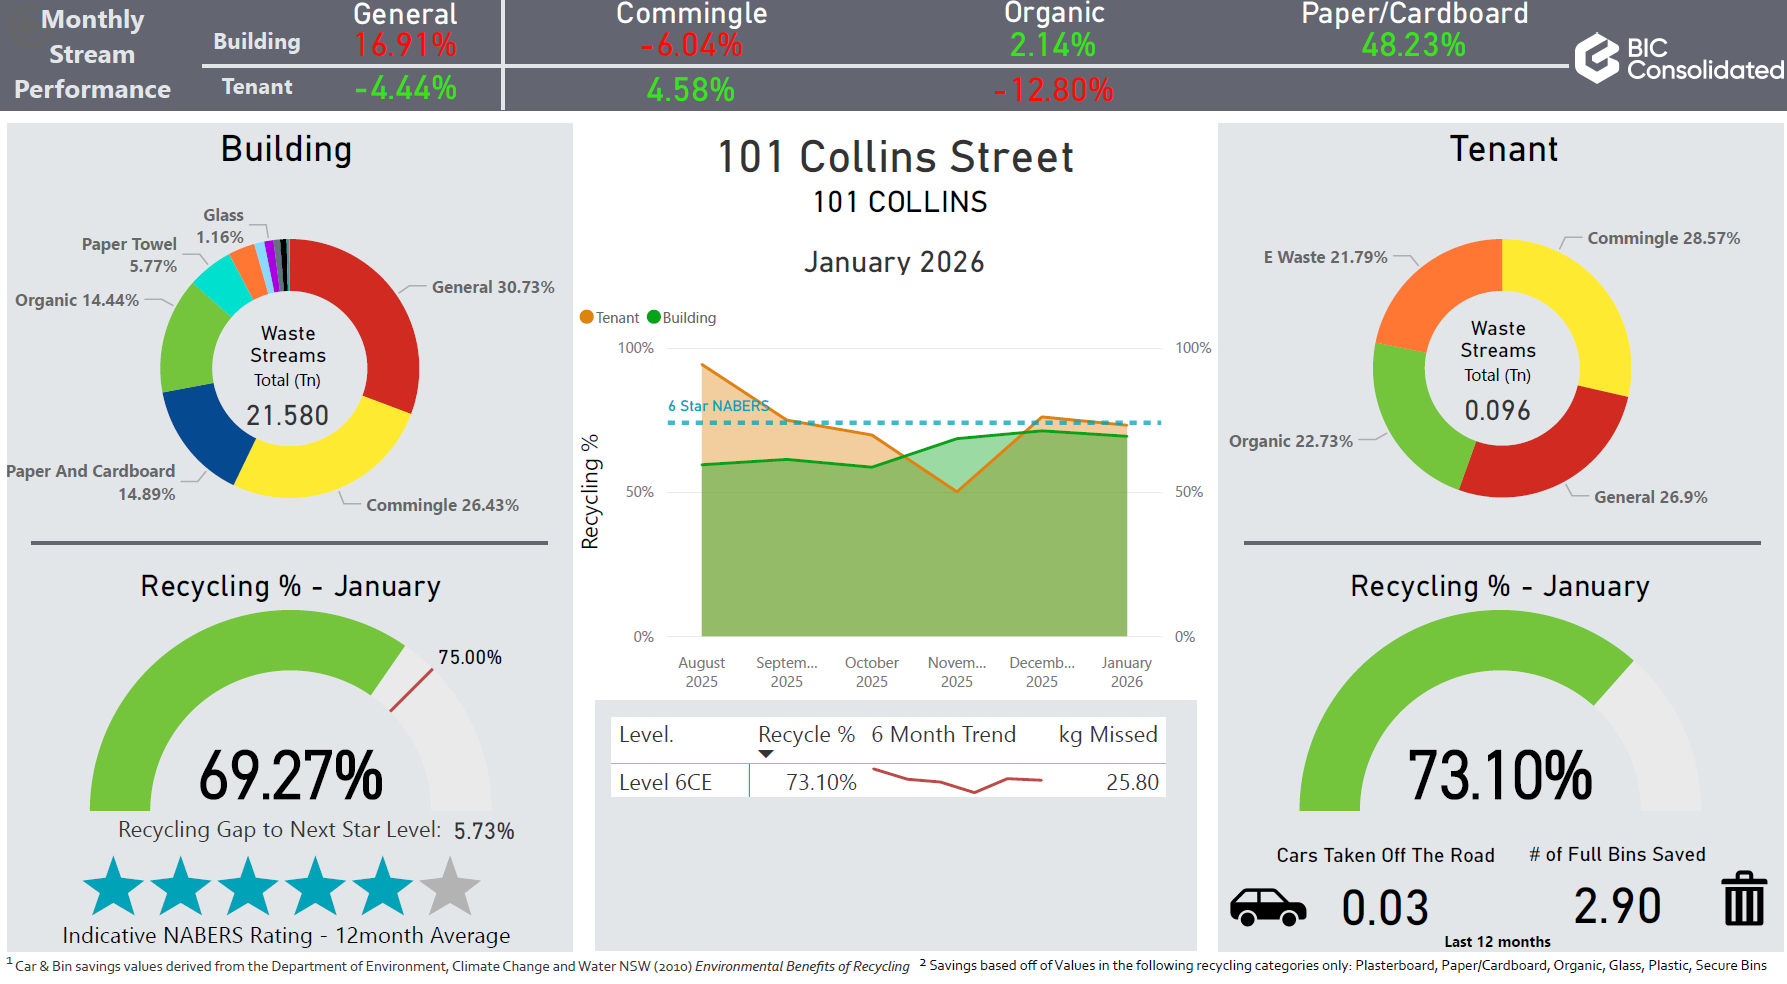
Building Performance
The report starts with a snapshot of how the whole building is managing waste across landfill, mixed recycling, organics, and paper/cardboard.
You’ll see:
• month-to-month changes
• overall recycling rates
• how we perform against NABERS Waste benchmarks
It’s a great way to understand how we’re performing as a community and where the biggest opportunities for improvement lie.
Your individual impact
The report provides a clear breakdown of your waste streams and recycling percentage along with two metrics that help you quantify your results.
• cars taken off the road
• full landfill bins saved
Tracking your progress
Your tenancy overview helps you to stay on top of your performance with:
• your month‑on‑month recycling performance
• the 6‑Star NABERS benchmark line as it relates to your results.
• this section helps you spot wins, notice patterns, and keep the momentum going.
What the colours mean
The colour coding makes it easy to see whether things are heading in the right direction
• less landfill = Good (Green)
• more recycling and organics = Good (Green)
The increased recycling rates are exactly the progress we’re aiming for as it’s all about diverting more material from landfill.
Why it matters
Every tenant plays a role in the building’s sustainability performance. By understanding your waste data, you can:
• identify opportunities
• celebrate your progress
• encourage better recycling habits within your team
• help create a more sustainable building
Small and consistent changes from everyone create big results; and your monthly report is there to help you keep that positive momentum going.